Plotting your T3D simulation results
Profile Plotting
T3D data is written to a python pickle file (.npy), a NetCDF4 file (.nc), and ADIOS2 output (.bp). All can be used by the t3d-plot plot utility.
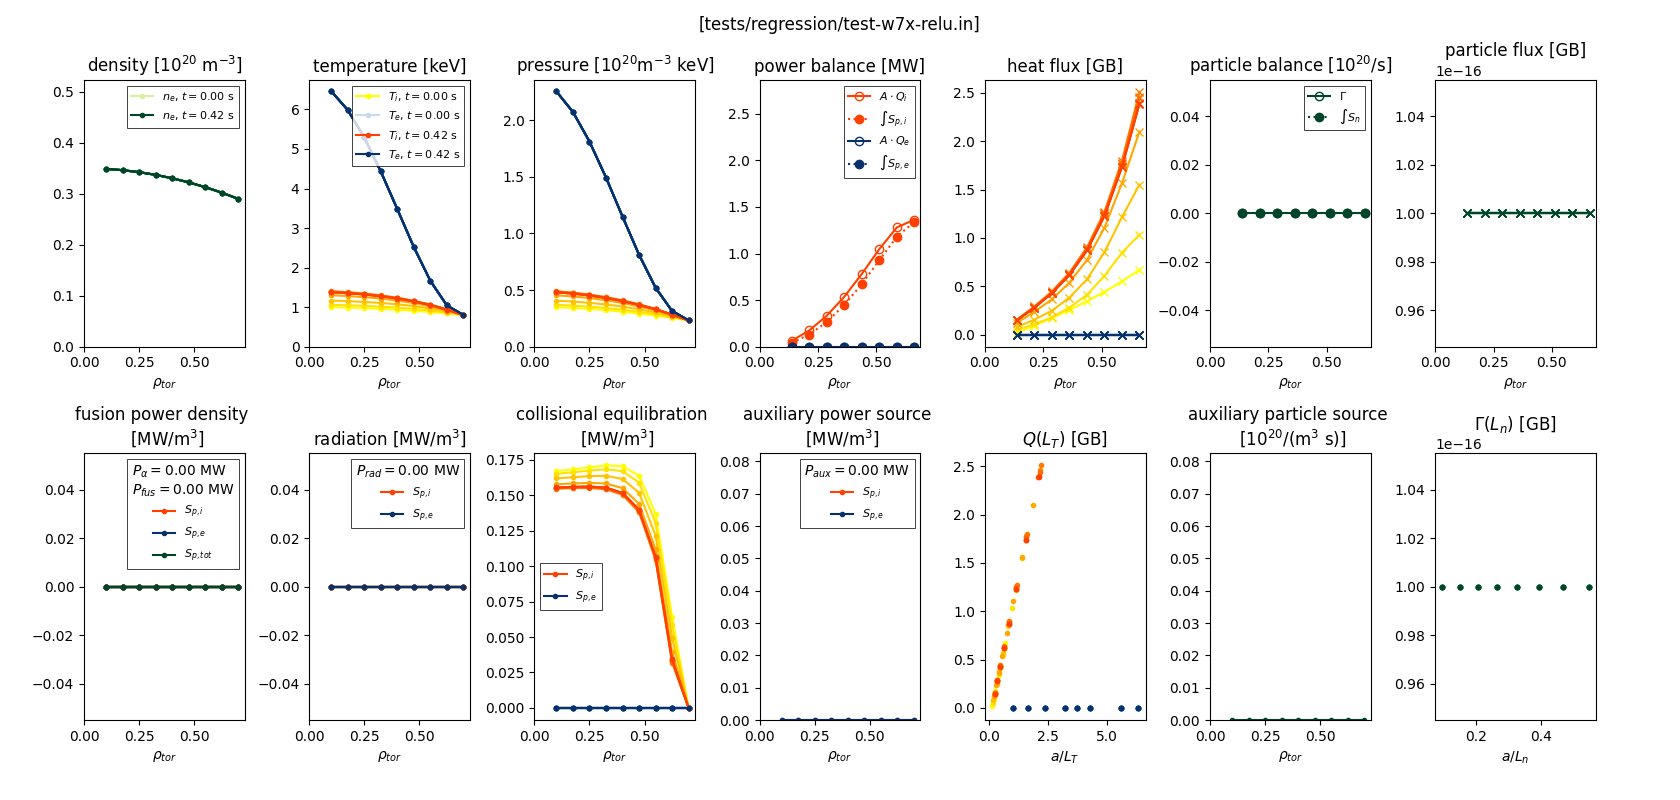
To create a panel summary plot of your results, use
t3d-plot tests/regression/test-w7x-relu.log.npy
t3d-plot tests/regression/test-w7x-relu.nc
t3d-plot tests/regression/test-w7x-relu.bp
The t3d-plot utility can also be used to generate individual plots
t3d-plot tests/regression/test-w7x-relu.bp -p density
Multiple-plots can be created using a space-separated list of plot names
t3d-plot tests/regression/test-w7x-relu.bp -p density temperature
Use the -l option to see a list of available plot functions
t3d-plot tests/regression/test-w7x-relu.bp -l
You can also create custom panel plots from the list of available plots
--panel rows cols          Create a panel plot from a list of plots
--figsize rowsize colsize  Specify the figure size
--title TITLE              Specify a title for the custom panel
Other useful arguments include
-g, --grid     to add a grid to the plot
-s, --savefig  to save the figure to a pdf file (skips view)

-t TIDX [TIDX ...], --tidx TIDX [TIDX ...]
               space separated list of time indices to plot (use -1 for the last time index);
               default plots all time slices
-i, --show_newton_iterations, --show-newton-iterations
               Plot intermediate Newton iterations
--list-times   to list the profile times and indices

-r RIDX [RIDX ...], --ridx RIDX [RIDX ...]
               space separated list of rho indices to plot; default plots all rho indices
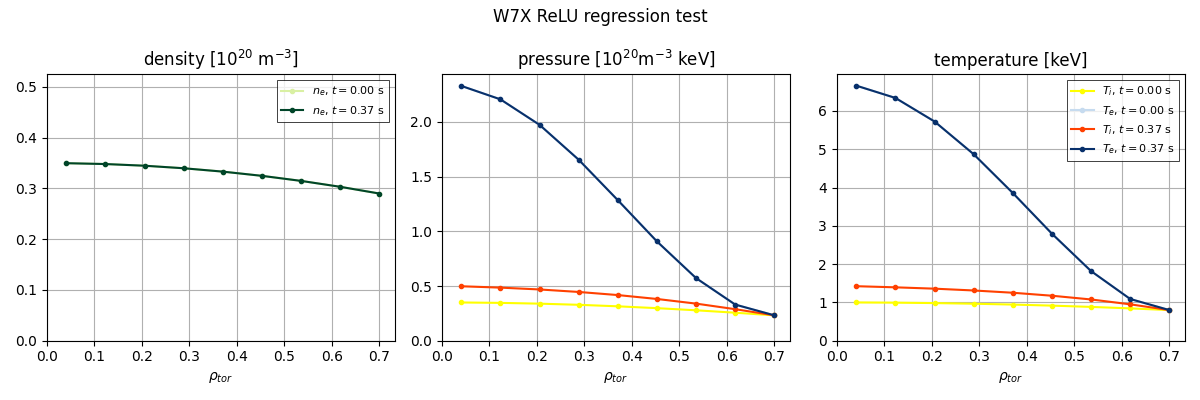
For example, to create a custom panel plot for the initial and final profiles of density, pressure, and temperature
t3d-plot tests/regression/test-w7x-relu.bp -g -t 0 -1 -p density pressure temperature --panel 1 3 --figsize 12 4 --title "W7X ReLU regression test"
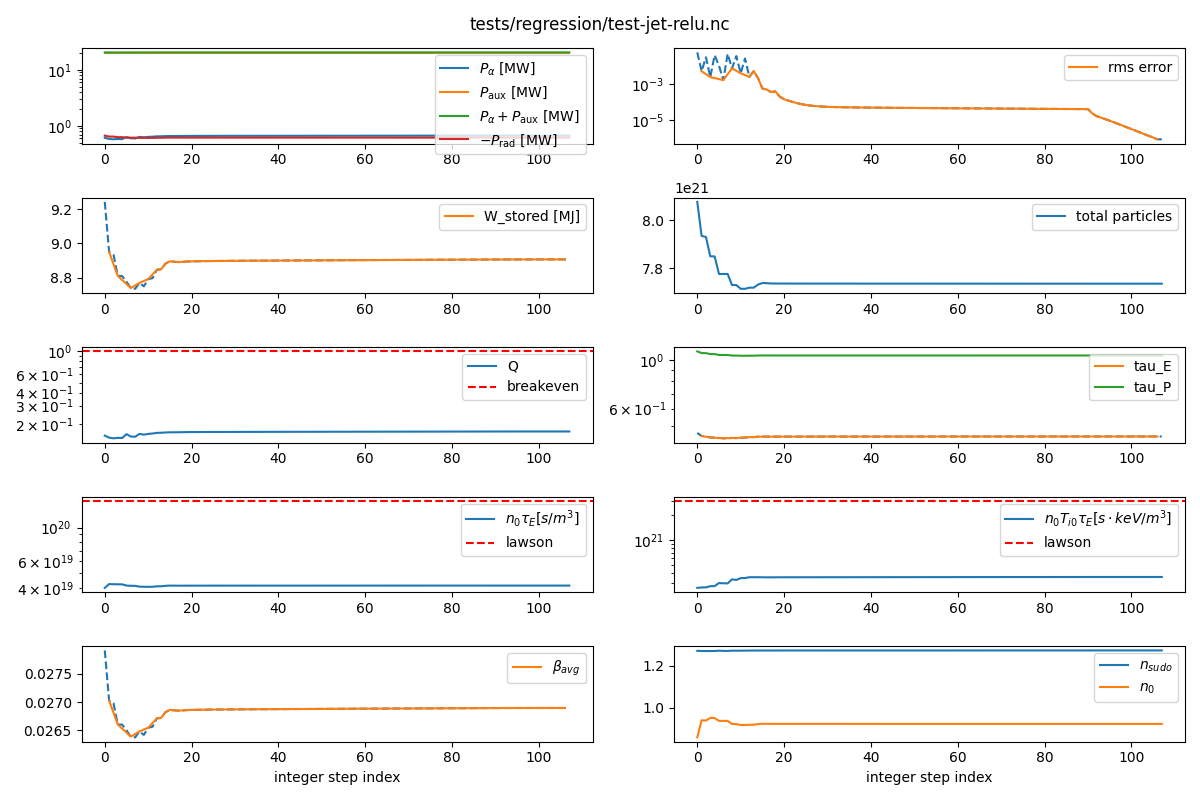
Timeseries Plots
The t3d-time-plot utility creates a panel plot of various T3D outputs versus step index.
t3d-time-plot tests/regression/test-jet-relu.log.npy
t3d-time-plot tests/regression/test-jet-relu.nc
t3d-time-plot tests/regression/test-jet-relu.bp
Available arguments include
-h, --help            show this help message and exit
-s, --save            Save plots to file rather than interactive display
-o OUTDIR, --outdir OUTDIR
                      Specifies an output directory
-n, --skip-newton-iterations
                      Skip Newton iterations
Source Sink Plots
The t3d-source-sink-plot utility creates a panel plot which will give insight into the sources and sinks.
t3d-source-sink-plot tests/regression/test-jet-relu.log.npy
t3d-source-sink-plot tests/regression/test-jet-relu.nc
t3d-source-sink-plot tests/regression/test-jet-relu.bp
